Trending Products
  Show more
  New Products
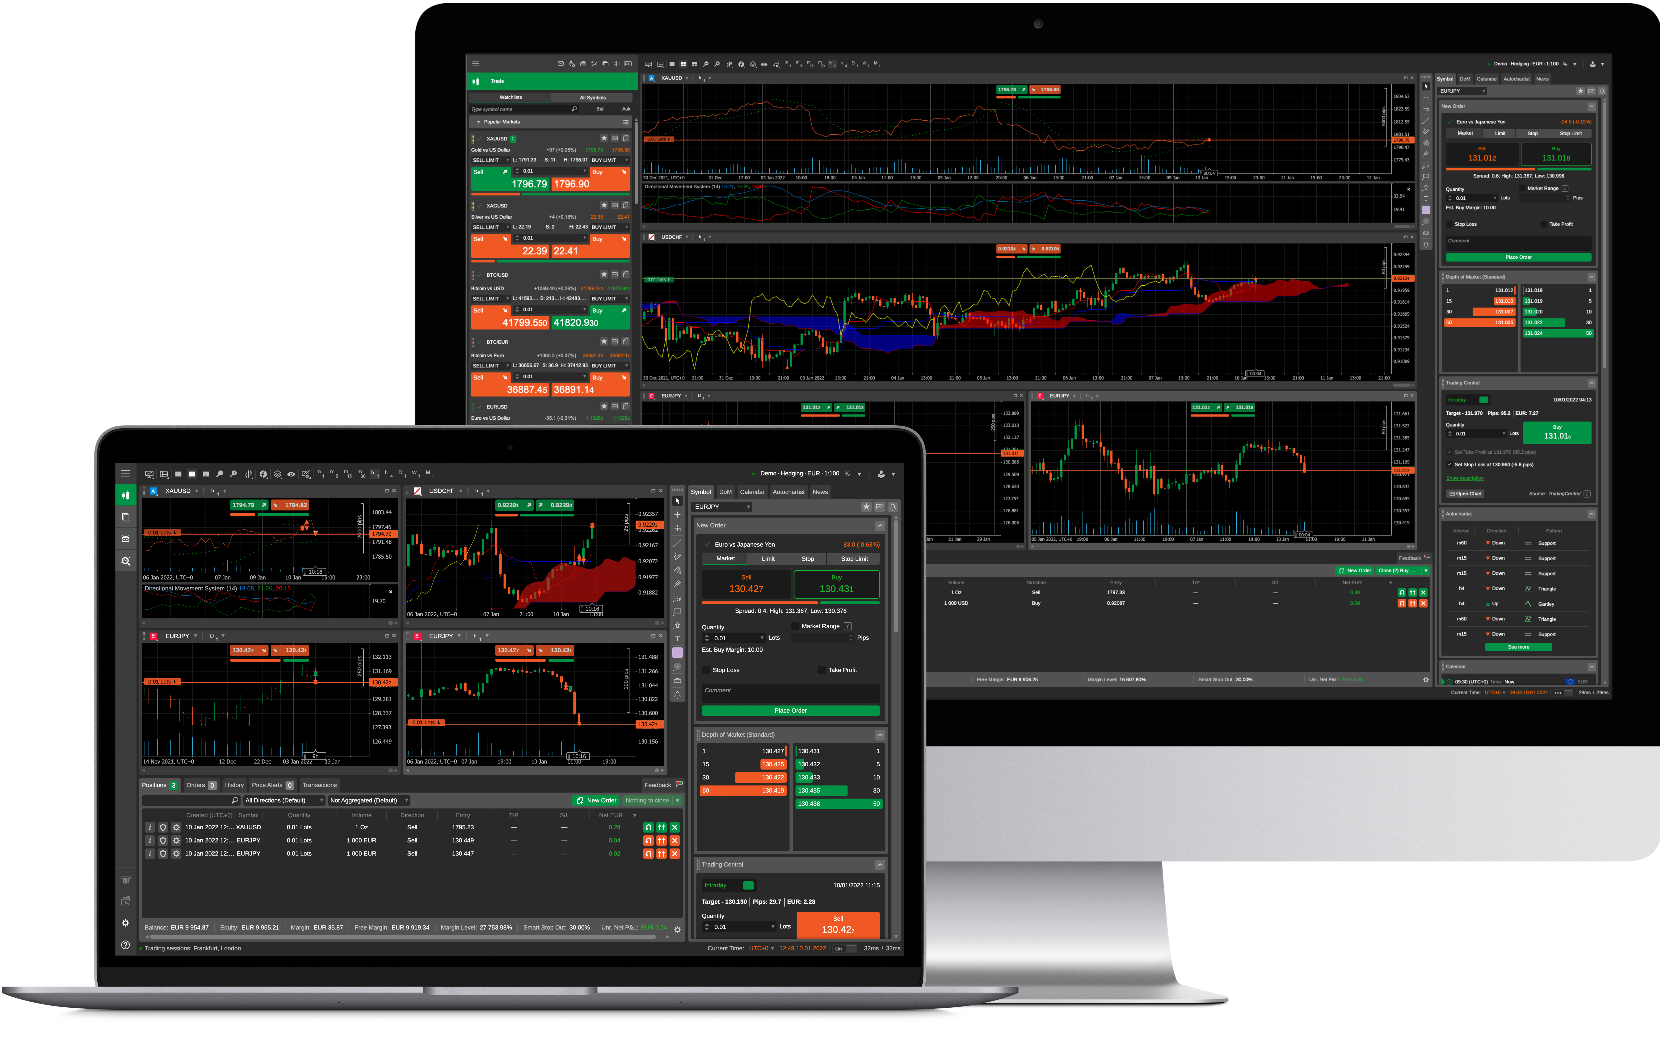


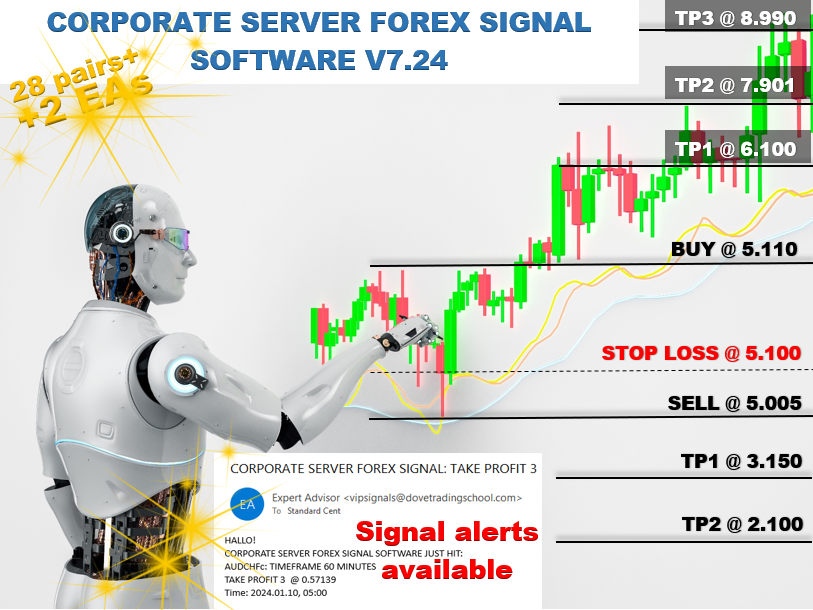
Get up to 50% Commission per sale

Experience the Future of Forex Trading. Dove FX Markets offers the most advanced software to empower your trading journey. Join us today and unlock your potential.
Register
Experience the Future of Forex Trading. Dove FX Markets offers the most advanced software to empower your trading journey. Join us today and unlock your potential.
Copyright © 2019-2024 DoveFXmarkets™️ Policy